Basic Aerodynamics

Aerodynamic Drag Equation
Ok, before we get into the details of cycling aerodynamics, let's start with the basic equation of the force applied to a body within a fluid flow. The force acting on the body (Fd) will be proportional to density of the fluid (p), which could be water, oil, air, even Rice Krispies! The cross sectional area of the body in the flow direction (A), the square of the flow velocity (V) and a drag coefficient that recognises the shape and surface texture of the object (Cd).

Power to Overcome Drag Force.
If you’re still reading this page, you were not turned off by the equation above, which is good news because here is another. You will note from the Drag Force equation that the force is proportional to the fluid velocity (squared), but you may have heard that drag is proportional to velocity (cubed). Both statements are true because Power = Force x Speed. So the drag FORCE is a squared term, but the POWER requirement to overcome that force and maintain a speed V is a cubed term. This explains why as cyclists we may be thrilled to move our average speed from 16-18mph, which to a non-cyclist could appear unimpressive. In reality, we would need to be generating 42% more power for a 12% improvement in speed!

Cycling Drag
Time to bring this back into the cycling environment and what you are all really interested in “How do I go faster for the same effort?”. In the context of riding bikes, the aerodynamic drag force acting in the opposite direction to the direction of travel (Fd) is dependent upon the relative density of the air, the actual speed relative to the air V(squared), the cross sectional area of the rider and bike perpendicular to the direction of travel and a coefficient Cd based on the shape of the combined bike / rider. The power requirement to overcome aerodynamic drag is this force(Fd) x windspeed(V). Things would be very simple if the drag were the only force slowing us down and at higher speeds it is by far the largest contributor. We can't ignore the other power requirements such as the mechanical friction in bearings and drivetrain and tyre rolling resistance. Changes in the potential energy on climbing or descending and kinetic energy on acceleration or deceleration (both rotational and translational) can also be significant. To keep things simple, let's assume steady state speeds on nice smooth, flat roads.
Skin Friction and Pressure Drag
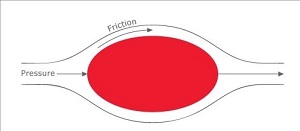
Ok, touched on bikes to keep you interested, but now we need to delve back into a bit of aerodynamic theory and some new terminology. This 'drag' force that is stopping us going any faster on our bikes is made up of two main constituents Skin Friction and Pressure Drag. The fluid flow around us and our bikes (hopefully air or we are in big trouble) will either be laminar or turbulent. Laminar flow is where the molecules within the fluid are all moving around the object in nice parallel lines. One could imagine that at the very surface of the object, on a microscopic level, the air molecules are either stuck to it, or nestling in the vast craters and valleys that appear to our naked eyes to be smooth. At this point, the fluid flow velocity relative to the object will be zero. As you move away from the surface other air molecules will stick to the close ones and form what is called a boundary layer, but the further you move from the objects surface, eventually you will achieve the fluid flow velocity V. The shear forces between the stationary or slow moving molecules and the rest of the fluid is Skin Friction. Skin friction will be higher at the leading edge of the object where the boundary layer is thinnest and the shear forces high.
Pressure Drag.
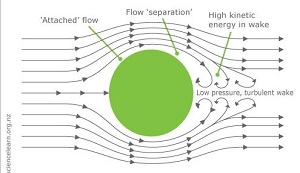
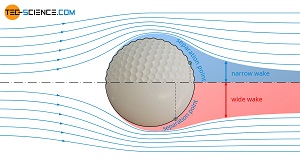
Pressure Drag for us cyclists is going to be higher than Skin Friction and where we can see the most significant gains. Let us imagine the fluid flowing around a body. The intra-molecular forces in the fluid will try to keep it attached, via the boundary layer to the object. We can draw an analogy to a car traversing a sharp bend. The intra-molecular forces are the traction between the tyres and road, but ultimately, if the vehicle speed is too high or the bend radii too tight, the car will leave the road. Or in our case here, the fluid will separate from the body, creating a low-pressure turbulent wake (no more nice parallel lines of molecules). It is easy to visualise Aerodynamic Drag as having to push air molecules out of the way in front of us, but in reality it is more a question of being sucked backwards by the low pressure behind us. The good news is that if the flow has detached, then Skin Friction will be significantly reduced. I could draw an analogy with the friction between tyre and road surface having reduced as the car is now on its roof, but I'm not sure that helps!
Pressure Recovery
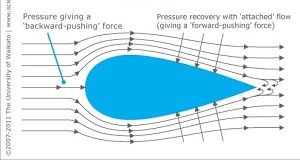
Aerodynamicists will talk about 'Pressure Recovery' as a means of reducing drag. This is about ensuring the flow remains attached in the first place, or reducing flow separation as much as possible. The principle means to do this is by minimising sharp shape transitions, giving the classic 'streamlined' teardrop profiles. Other than this bonkers chap on YouTube (https://youtu.be/bvmibwafGXc), people as a rule are only remotely streamlined when diving or swimming. We can see streamlining is in many bike parts, including deep section wheels, wing profile handlebars, frame sections, bladed spokes etc.
Aerodynamic Trips
Where we might be able to retrieve some pressure in the cycling environment is via the use of aerodynamic 'trips'. One very useful aerodynamic phenomena is that a turbulent boundary layer will stay attached longer than a laminar one. By creating a small disturbance in the attached flow towards the leading edge, the small turbulence in the ensuing flow will reduce flow separation. The classic example of this is the dimpled golf ball. We are seeing this more often now in cycling clothing, with the shoulders being an ideal place to place a rougher textured material.
Kamm Tails
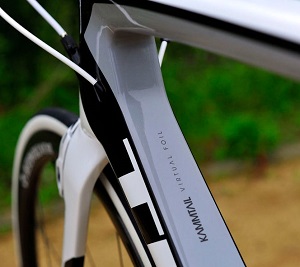
The bike industry has been exceedingly proud of its adoption of true 'Rocket Science', namely the use of truncated aerofoil sections as popularised by Wunibald Kamm. The fact that Kamm died in 1966 and the technology was first used in the automotive industry in the 1930's is neither here nor there! The Kamm tail works because a turbulent wake region forms behind the vertical surface and this wake mimics the effect of the tapered tail. To a large extent, the air flow around the truncated aerofoil section does not know any difference and acts as if the tail is still in situ, minimising the low pressure region behind it.
Yaw Angles (mu)
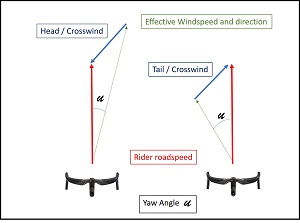
This summary of basic aerodynamics has started with some equations, then looked at the means to reduce aerodynamic drag. Up until now, we have assumed flow around the object (wind around us on our bikes) is entirely from the head on direction, but sadly, this is not what happens in real life apart from very still windless days. We need to introduce the idea of 'Yaw Angle' which for us cyclists can be significant. The UK is a windy country, which is great for electrical power generation, but with an average Meteorological Wind speed of around 10mph, it can be irritating as well as throwing our calculations out. With typical cycling speeds around 10-20mph, a 10mph wind is relatively significant compared to faster motorised traffic. We have all experienced the effort of riding into a headwind and the bliss of a fast tailwind, but some form of crosswind is the most likely direction. To calculate yaw angle we need to resolve the applied wind into two vectors, one in the direction of travel and one at 90°. By adding the forwards road speed, we get an effective wind speed and direction. The angle between the effective wind direction and the direction of travel is the yaw angle. With average wind speeds of 10mph then surely our yaw angles must be quite high? Actually no, because the Meteorological wind speed is measured at 10m above ground level and remember that boundary layer from earlier? The actual wind speed down at our level will be lower than the 10mph average. Typically, we will be riding with yaw angles in the region of 0-10°.
DIY Dynamic Bike Fitting
You may be interested in our downloadable DIY guide.
49 Page PDF download describing all the observations, simple measurements and calculations required to do your own Dynamic Bike Fits.
Revision 2 released May 2020.
Contains updated male and female saddle height calculators and new information on male / female leg length proportions. Plus a new section to assist with saddle choice and improving comfort.
British Pound, Euro and US Dollar payments are processed by PayPal and all major credit cards are accepted. You will receive an email confirming your payment and will be automatically redirected to a page where you can download the ebook. The ebook is in PDF format so you will need to have a copy of Adobe Acrobat Reader or a similar PDF reader to read the ebook.

